
A new study reveals that, based on crash data from 2019 to 2023, passengers in Texas are statistically safer riding a taxi than an ambulance.
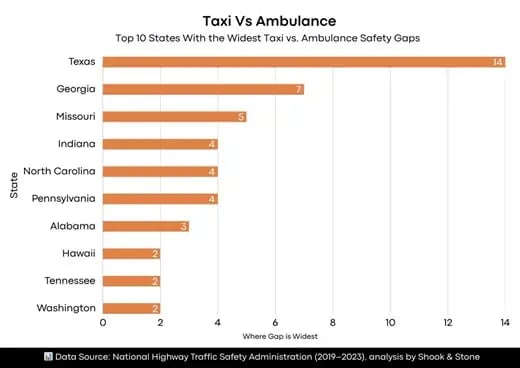
The research by the Las Vegas-based personal injury law firm Shook & Stone analyzed crash data from the National Highway Traffic Safety Administration (NHTSA) for taxi and ambulance crashes from 2019 to 2023 across all 50 states. The study calculated the total crashes for each vehicle type to identify the top 10 states where the safety gap is most pronounced.
Texas leads with a disparity of 14 incidents, recording 14 ambulance crashes against zero taxi crashes between 2019 and 2023. Ambulance crashes in Texas peaked at six in 2021 and were lowest at two crashes in 2020 and 2023.
Georgia ranks second with a disparity of seven incidents, recording 10 ambulance crashes against three taxi crashes between 2019 and 2023. Taxi crashes remained minimal, with the highest count being one crash in three separate years (2019, 2022, and 2023) and zero in 2020 and 2021. Ambulance crashes peaked at three in 2019, 2021, and 2023, and were lowest at two in 2020 and 2022.
Missouri ranks third with a disparity of five incidents, documenting five ambulance crashes compared to zero taxi crashes. Ambulance crashes were highest at two in 2022 and 2023, while 2019 and 2020 recorded zero crashes each.
Looking at the study, a spokesperson at Shook & Stone commented:
"The study highlights that states such as Texas, Georgia, and Missouri show significant safety disparities between taxi and ambulance transportation.
"These findings raise important questions about emergency vehicle safety protocols and training requirements. While ambulances operate under more challenging conditions in emergency response situations, the data suggests there may be opportunities to improve safety outcomes for both patients and emergency medical personnel.
"To address these disparities, state transportation officials and emergency medical services could consider enhanced driver training programs, improved vehicle maintenance protocols, and better safety equipment standards. Addressing emergency response, driving conditions, and route safety could help reduce ambulance crash rates across these states."
Indiana ranks fourth with a disparity of four incidents, recording two total taxi crashes versus six ambulance crashes. Taxi crashes were highest at one crash in both 2021 and 2022, with zero crashes in 2019, 2020, and 2023. Ambulance crashes peaked at three in 2021 and were lowest at zero in 2019.
North Carolina ranks fifth, with a disparity of four incidents documenting four taxi crashes compared to eight ambulance crashes. Taxi crashes were highest at 3 in 2021 and lowest at zero crashes in 2019, 2020, and 2023. Ambulance crashes peaked at 3 in 2022 and were lowest at one crash in 2020.
Pennsylvania (6th) recorded a disparity of four incidents, followed by Alabama (7th) with a disparity of three incidents, Hawaii (8th) with a disparity of two incidents, Tennessee (9th) with a disparity of two incidents, and Washington (10th) with a disparity of two incidents.
Table for Extended Results
| Top 10 States With the Widest Taxi vs. Ambulance Safety Gaps | ||||
| State | Total Taxi Crashes 2019-2023 | Total Ambulance Crashes 2019-2023 | Where is the Gap Widest | Rank |
| Texas | 0 | 14 | 14 | 1 |
| Georgia | 3 | 10 | 7 | 2 |
| Missouri | 0 | 5 | 5 | 3 |
| Indiana | 2 | 6 | 4 | 4 |
| North Carolina | 4 | 8 | 4 | 5 |
| Pennsylvania | 3 | 7 | 4 | 6 |
| Alabama | 0 | 3 | 3 | 7 |
| Hawaii | 0 | 2 | 2 | 8 |
| Tennessee | 3 | 5 | 2 | 9 |
| Washington | 0 | 2 | 2 | 10 |
The study was conducted by Shook & Stone, a law firm dedicated to fighting for the rights of injured and disabled individuals, ensuring they receive the justice and compensation they deserve while providing compassionate, personalized legal representation.
ENDS
P.S. If using this story, please credit and link to www.shookandstone.com/
Methodology
The research analyzed crash data from the National Highway Traffic Safety Administration (NHTSA) for taxi and ambulance crashes from 2019 to 2023 across all 50 states. The study calculated the total crashes for each vehicle type to identify the top 10 states where the safety gap is most pronounced.
Data Source
- Taxi and Ambulance Crash Data: https://cdan.dot.gov/SASJobExecution/
- Research Dataset: https://docs.google.com/spreadsheets/d/1GGGvOX4RSWWiU20Oq-M1x21Gez8e__A-XtZAJ6EYdFQ/edit?gid=0#gid=0
- Research by: shookandstone.com/
Copyright © 2025 California Business Journal. All Rights Reserved.
For California Business Journal Disclaimers, go to /terms-conditions/.


