According to the new data, Colusa County is identified as California's most hazardous location for pedestrians.
The study by California-based personal injury lawyers J&Y Law examined 2022 pedestrian collision statistics (the latest comprehensive data available) from the California Department of Transportation across the state's 58 largest counties. Through calculating incident rates against population figures, the analysis determined which counties pose the greatest pedestrian dangers.
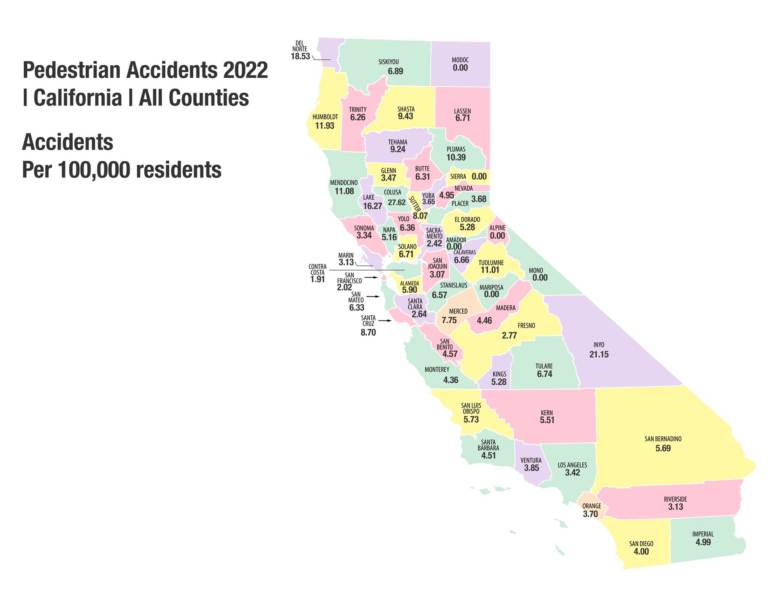
Colusa is the most hazardous county for pedestrians, with 27.62 accidents per 100,000 people, more than four times California's overall rate of 6.09. Six total collisions in 2022 caused one death and five injuries on standard roadways.
Inyo County ranks second with 21.15 accidents per 100,000 residents, exceeding the state rate by over three times. Among four total accidents, the county experienced one death and three injuries on standard roadways.
Del Norte County secures the third position with 18.53 accidents per 100,000 residents, surpassing the statewide average of 6.09 more than three times. Though no deaths occurred among the five total collisions in 2022, the county recorded five injuries across expressways and standard roads.
Looking at the study, Yosi Yahoudai, Esq., Co-founder and Managing Partner of J&Y Law, commented:
“The analysis shows a pattern where the top 10 counties are predominantly rural. In counties like Colusa and Inyo, sparse population densities typically result in fewer resources dedicated to infrastructure enhancements and monitoring. Roads are commonly designed for vehicles instead of pedestrians, featuring fewer crosswalks and compromised visibility from narrow or winding roadways.
“Furthermore, rural highways can promote speeding, as drivers face less traffic congestion. When combined with elements like inadequate lighting and unexpected pedestrian presence, collision risks rise substantially.”
Lake County ranks fourth with 16.27 accidents per 100,000 residents, 167% above the statewide average of 6.09. The county documented 11 total collisions, including three deaths and eight injuries, across expressways, freeways, and standard roads.
Humboldt County is fifth with 11.93 accidents per 100,000 residents—nearly double the state rate. Among 16 total accidents in 2022, the county experienced five deaths and 11 injuries on expressways, freeways, one-way city streets, and standard roads.
Mendocino County ranks sixth with 11.08 accidents per 100,000 residents, followed by Tuolumne County in seventh with 11.01 accidents. Plumas County takes eighth place with 10.39 accidents per 100,000 residents, while Shasta County ranks ninth with 9.43 accidents, and Tehama County comes in tenth with 9.24 accidents per 100,000 people.
Table of Extended Results
| California Counties with the Highest Pedestrian Accidents | |||||
| County | Fatalities | Injuries | Total Accidents 2022 | Accidents Per 100,000 residents | Rank |
| Colusa | 1 | 5 | 6 | 27.62 | 1 |
| Inyo | 1 | 3 | 4 | 21.15 | 2 |
| Del Norte | 0 | 5 | 5 | 18.53 | 3 |
| Lake | 3 | 8 | 11 | 16.27 | 4 |
| Humboldt | 5 | 11 | 16 | 11.93 | 5 |
| Mendocino | 2 | 8 | 10 | 11.08 | 6 |
| Tuolumne | 1 | 5 | 6 | 11.01 | 7 |
| Plumas | 0 | 2 | 2 | 10.39 | 8 |
| Shasta | 5 | 12 | 17 | 9.43 | 9 |
| Tehama | 2 | 4 | 6 | 9.24 | 10 |
The study was conducted by J&Y Law, an experienced personal injury law firm dedicated to personal injury cases — including serious injuries and wrongful death — and committed to protecting clients' rights as well as maximizing their claim’s value.
END
P.S. If using this story, please credit and link to www.jnylaw.com.
Methodology
The research examined 2022 pedestrian collision statistics (the latest comprehensive data available) from the California Department of Transportation across the state's 58 largest counties. Through calculating incident rates against population figures, the analysis determined which counties pose the greatest pedestrian
Data Sources
- Pedestrian accidents → https://dot.ca.gov/-/media/dot-media/programs/research-innovation-system-information/documents/annual-collision-data/2022-crash-data-on-cshwy-book-fixed-v2-a11y.pdf
Research
- Dataset → https://docs.google.com/spreadsheets/d/1zDI87nOealPlJr1odpQrDd5FPZBo11u4o8CJKVA7b9A/edit?usp=sharing
Study Conducted by → www.jnylaw.com
Copyright © 2025 California Business Journal. All Rights Reserved.
For California Business Journal Disclaimers, go to /terms-conditions/.


