
Key Highlights
- California recorded 2,237 hit-and-run deaths across 2,178 fatal crashes between 2019 and 2023, averaging 447 deaths per year and earning a danger score of 72.9 out of 100 to rank 5th nationally.
- California's 2,237 deaths represent 16.8 percent of all 50-state hit-and-run fatalities and approximately 59 percent of all western state deaths, yet the state ranks only 5th nationally in per-capita risk at 5.7 deaths per 100,000 residents.
- Arizona ranks above California in both per-capita rate (6.1 vs. 5.7) and danger score (75.5 vs. 72.9) despite recording 80 percent fewer total deaths, exposing a sharp divide between sheer volume and true individual risk.
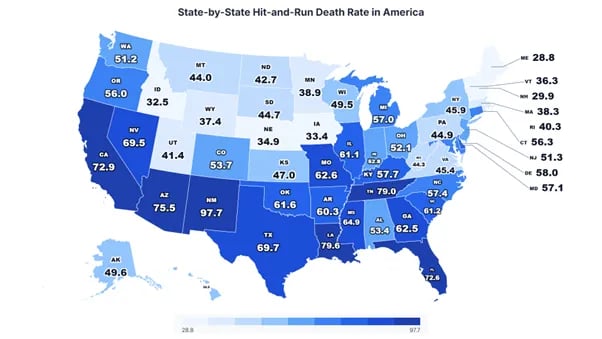
Every 20 hours, a driver in California flees the scene of a fatal crash, leaving another life lost on the state's roads. Between 2019 and 2023, 2,237 Californians were killed in hit-and-run incidents across 2,178 fatal crashes, making the Golden State the deadliest in the nation by raw volume while its 39 million residents still face a per-capita rate of 5.7 deaths per 100,000.
A new study by DeHoyos Accident Attorneys reveals how California's population scale inflates national tallies while masking a per-capita danger that firmly places it among America's most perilous states for hit-and-run fatalities.
California’s Hit-and-Run Danger at a Glance
| Metric | California | National Standing |
| Total Deaths (2019-2023) | 2,237 | Highest in nation |
| Annual Average Deaths | 447 | Highest in nation |
| Fatal Crashes (2019-2023) | 2,178 | Highest in nation |
| Deaths per 100,000 Residents | 5.7 | 5th nationally |
| Deaths per Fatal Crash | 1.03 | 27th nationally |
| Hit-and-Run Danger Score | 72.9 / 100 | 5th nationally |
California's five-year toll of 2,237 deaths is the highest raw count of any state, yet a per-capita rate of 5.7 deaths per 100,000 places it 5th nationally. The state's danger score of 72.9 reflects the combined weight of volume and crash severity, ranking it firmly in the top-five most dangerous states for hit-and-run fatalities.
California Against Its Western Neighbors
| State | Total Deaths | Deaths per 100k | National Rank |
| Arizona | 451 | 6.1 | 4th |
| California | 2,237 | 5.7 | 5th |
| Nevada | 170 | 5.3 | 8th |
| Oregon | 150 | 3.5 | 22nd |
| Colorado | 199 | 3.4 | 23rd |
| Washington | 232 | 3.0 | 28th |
Arizona holds the highest per-capita rate among the contiguous western states at 6.1 deaths per 100,000, edging California’s 5.7 despite recording 80 percent fewer total deaths. California accounts for approximately 59 percent of all western state hit-and-run fatalities, underscoring how population density concentrates the region’s total burden within a single state.
Volume vs. Risk: The California Paradox
| Measure | Value | Context |
| Raw Deaths (2019-2023) | 2,237 | 1st nationally by total count |
| Per-Capita Death Rate | 5.7 per 100k | 5th nationally |
| Share of All 50-State Deaths | 16.8% | Highest single-state share |
| Share of Western State Deaths | 58.9% | Largest single-state share in West |
| Raw Count vs. Per-Capita Gap | 4 positions | Population inflates raw volume |
California's raw death count of 2,237 places it four positions higher in volume than its 5th-place per-capita ranking, representing 16.8 percent of all 50-state hit-and-run fatalities. Adjusting for population reveals that a Californian faces statistically similar individual risk to residents of Florida and Texas, states with far smaller absolute death tolls.
Methodology
DeHoyos Accident Attorneys analyzed California's fatal hit-and-run crash data from the National Highway Traffic Safety Administration's Fatality Analysis Reporting System (NHTSA FARS) covering 2019 through 2023, combined with 2023 U.S. Census Bureau population estimates. Per-capita death rates were calculated per 100,000 residents. The Hit-and-Run Danger Score combines normalized death rates weighted at 70 percent with crash severity (deaths per fatal crash) weighted at 30 percent, scaled 0 to 100. Western-state comparisons include all 13 contiguous and non-contiguous western states. California-specific findings are drawn directly from this national dataset.
Data Sources
- National Highway Traffic Safety Administration (NHTSA) https://cdan.dot.gov/query
- U.S. Census Bureau 2023 Population Estimates https://data.census.gov/table/ACSST1Y2023.S0101
- Research dataset: https://docs.google.com/spreadsheets/d/1uJrK4xjOUTLQlPaIbO8TUAi6y2bzJh0SmX7NLLTOf9g/edit?usp=sharing
- Study by: https://www.dehoyosinjury.com/
About DeHoyos Accident Attorneys
DeHoyos Accident Attorneys represents motor vehicle accident victims including hit-and-run crashes, securing compensation for medical expenses and damages. The firm combines aggressive legal advocacy with data-driven safety analysis to promote accountability and safer roadways nationwide.
Copyright © 2026 California Business Journal. All Rights Reserved.
For California Business Journal Disclaimers, go to /terms-conditions/.


