
Key Highlights
- California ranks 10th nationally with 0.37 alcohol-related pedestrian deaths per 100,000, 1.8 times the 0.21 national average.
- With 1,434 total deaths over the decade, California leads all 50 states in raw pedestrian fatalities, averaging 143.4 per year.
- California accounts for 21.2% of all national alcohol-related pedestrian deaths while holding just 12.0% of the U.S. population.
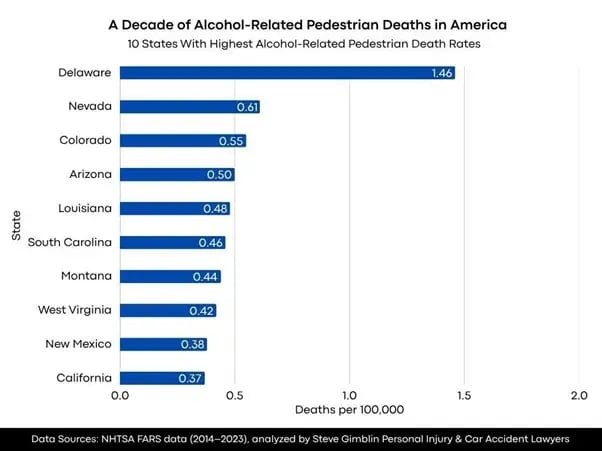 Every two and a half days for the past decade, a drunk driver has struck and killed a pedestrian somewhere in California, making it the deadliest state in raw numbers by a wide margin. The state’s 1,434 fatalities account for more than a fifth of every such death recorded nationwide, a burden no other state comes close to matching.
The study by Steve Gimblin Personal Injury & Car Accident Lawyers, analyzed FARS data from 2014–2023, examining pedestrian deaths involving drivers with BAC of 0.08 or higher. California was ranked against all 50 states by deaths per 100,000 residents.
California Tops All States in Total Pedestrian Deaths
| Rank | State | Total Deaths | Avg Annual Deaths | Deaths per 100,000 | Avg Population |
| 1 | California | 1,434 | 143.4 | 0.37 | 39,175,001 |
| 2 | Texas | 856 | 85.6 | 0.30 | 28,756,379 |
| 3 | Arizona | 357 | 35.7 | 0.50 | 7,123,545 |
| 4 | North Carolina | 349 | 34.9 | 0.34 | 10,379,669 |
| 5 | Colorado | 313 | 31.3 | 0.55 | 5,671,667 |
California’s 1,434 deaths over the decade are 68% more than second-place Texas at 856, and four times third-place Arizona’s 357. Despite ranking only 10th per capita, the sheer volume of fatalities underscores the scale of California’s crisis.
Looking at the study, Steve Gimblin, Founder of Steve Gimblin Personal Injury & Car Accident Lawyers, commented:
"The 222-fold disparity between the highest and lowest nonzero rates proves that geography determines pedestrian fate when drunk drivers are involved. These aren’t random tragedies but predictable outcomes of infrastructure, enforcement, and policy choices that either protect pedestrians or leave them vulnerable on our roads."
California Safer Per Capita Than Nevada and Arizona
| Rank | State | Deaths per 100,000 | Avg Annual Deaths | Avg Population |
| 2 | Nevada | 0.61 | 18.5 | 3,031,131 |
| 4 | Arizona | 0.50 | 35.7 | 7,123,545 |
| 10 | California | 0.37 | 143.4 | 39,175,001 |
| 28 | Oregon | 0.16 | 6.7 | 4,157,695 |
Among its border states, California’s 0.37 per-capita rate falls below Nevada’s 0.61 and Arizona’s 0.50 but is 2.3 times higher than Oregon’s 0.16. Nevada, ranked 2nd nationally, has a rate 67% higher than California despite having less than a tenth of its population.
California 6th Among 13 Western States
| Western Rank | State | Region | Deaths per 100,000 | National Rank |
| 1 | Nevada | West | 0.61 | 2 |
| 2 | Colorado | West | 0.55 | 3 |
| 3 | Arizona | West | 0.50 | 4 |
| 4 | Montana | West | 0.44 | 7 |
| 5 | New Mexico | West | 0.38 | 9 |
| 6 | California | West | 0.37 | 10 |
| 7 | Wyoming | West | 0.29 | 14 |
| 8 | Idaho | West | 0.25 | 16 |
California ranks 6th among 13 Western states with a 0.37 rate, sitting 21% above the Western regional average of 0.30 per 100,000. Five Western states rank higher, led by Nevada, Colorado, and Arizona, all of which occupy the national top five.
Highest Per Capita Rate Among 10 Largest States
| State | Population Rank | Deaths per 100,000 | Avg Annual Deaths | Risk Rank |
| California | 1 | 0.37 | 143.4 | 10 |
| Texas | 2 | 0.30 | 85.6 | 12 |
| Florida | 3 | 0.01 | 1.4 | 49 |
| New York | 4 | 0.05 | 8.9 | 45 |
| Pennsylvania | 5 | 0.10 | 12.3 | 39 |
| Illinois | 6 | 0.10 | 13.3 | 37 |
| Ohio | 7 | 0.12 | 14.0 | 34 |
| Georgia | 8 | 0.20 | 21.3 | 17 |
| North Carolina | 9 | 0.34 | 34.9 | 11 |
| Michigan | 10 | 0.18 | 18.2 | 21 |
Among the ten most populous states, California holds the highest per-capita rate at 0.37, followed by North Carolina at 0.34 and Texas at 0.30. Florida’s 21 million residents produce just 0.01 per 100,000, proving that a large population alone does not dictate high risk.
California’s Decade at a Glance
| Metric | California | National |
| Total Deaths (2014–2023) | 1,434 | 6,775 |
| Avg Annual Deaths | 143.4 | 677.5 |
| Rate per 100,000 | 0.37 | 0.21 |
| National Rank | 10th | — |
| Avg Population | 39,175,001 | 326,659,577 |
Over ten years, California lost 1,434 pedestrians to drunk drivers while its population grew by 1.0%, rising from 38.60 million in 2014 to 38.97 million in 2023. The state’s massive scale means even a moderate per-capita rate translates into the nation’s largest absolute death toll.
Methodology
This analysis examined FARS data from 2014–2023, focusing on pedestrian deaths involving drivers with BAC of 0.08 g/dL or higher in California. Total deaths were averaged across ten years and divided by average population (U.S. Census Bureau estimates) to calculate deaths per 100,000 residents. California was then compared against border states, Western region peers, and the ten most populous states.
Data Sources
Fatality Analysis Reporting System (FARS), National Highway Traffic Safety Administration: https://cdan.dot.gov/query
Research Dataset: https://docs.google.com/spreadsheets/d/1lvqiRNFCusowf5qEUSS66n0IHt6FbR2rqa1MwJewVCo/edit?usp=sharing
Study By: https://yubalaw.com/
About Steve Gimblin Personal Injury & Car Accident Lawyers
Steve Gimblin Personal Injury & Car Accident Lawyers represents individuals and families affected by motor vehicle accidents and wrongful death cases throughout Northern California. Beyond legal representation, the firm conducts data-driven traffic safety research to raise awareness about preventable tragedies and inform public policy discussions.
Copyright © 2026 California Business Journal. All Rights Reserved.
For California Business Journal Disclaimers, go to /terms-conditions/.


